Search & Download
Settings
By default, work directory will be the directory where insarhub-app is run, user may
specify the work directory under setting
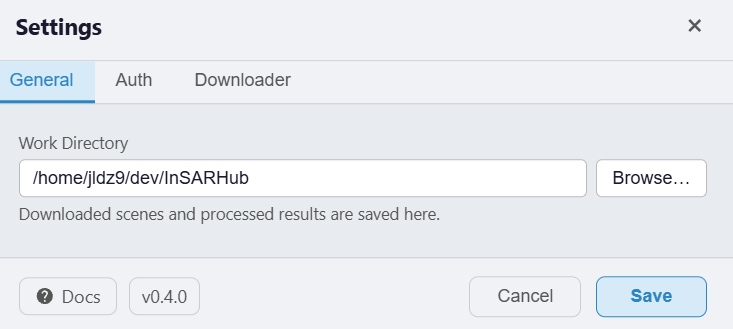
Settings panel showing work directory and API configuration.
Searching for Scenes
- Select a downloader
- Draw an AOI on the map
- Set the date range (default is
S1_SLC) - Click Search
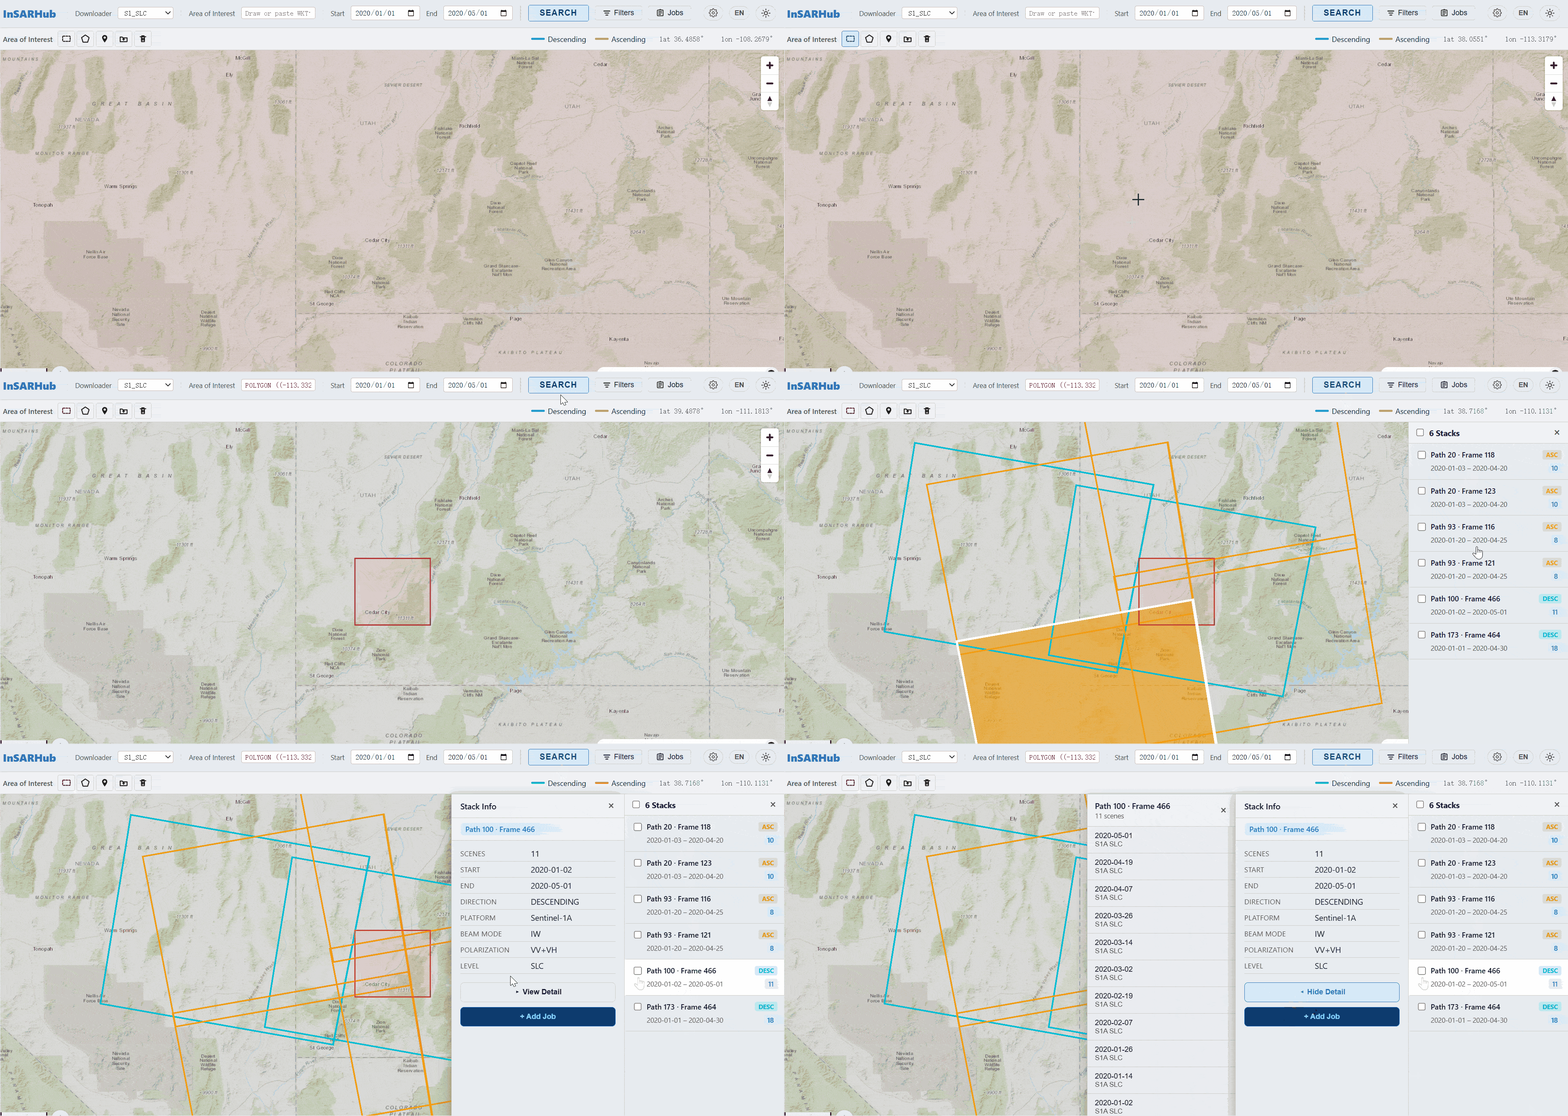
Search panel showing available Sentinel-1 stacks.
Search results appear as footprints overlaid on the map. Click any footprint to open the Scene Detail panel, which displays acquisition metadata including platform, orbit, beam mode, polarization, file size, and download options for that scene.
Click ▸ View Detail in the Scene Detail panel to expand the job drawer showing the full list of individual scenes in the stack. Click ◂ Hide Detail to collapse it.
Check sigle or multiple footprints in the stack panel, click +Add Job to create a process directory.
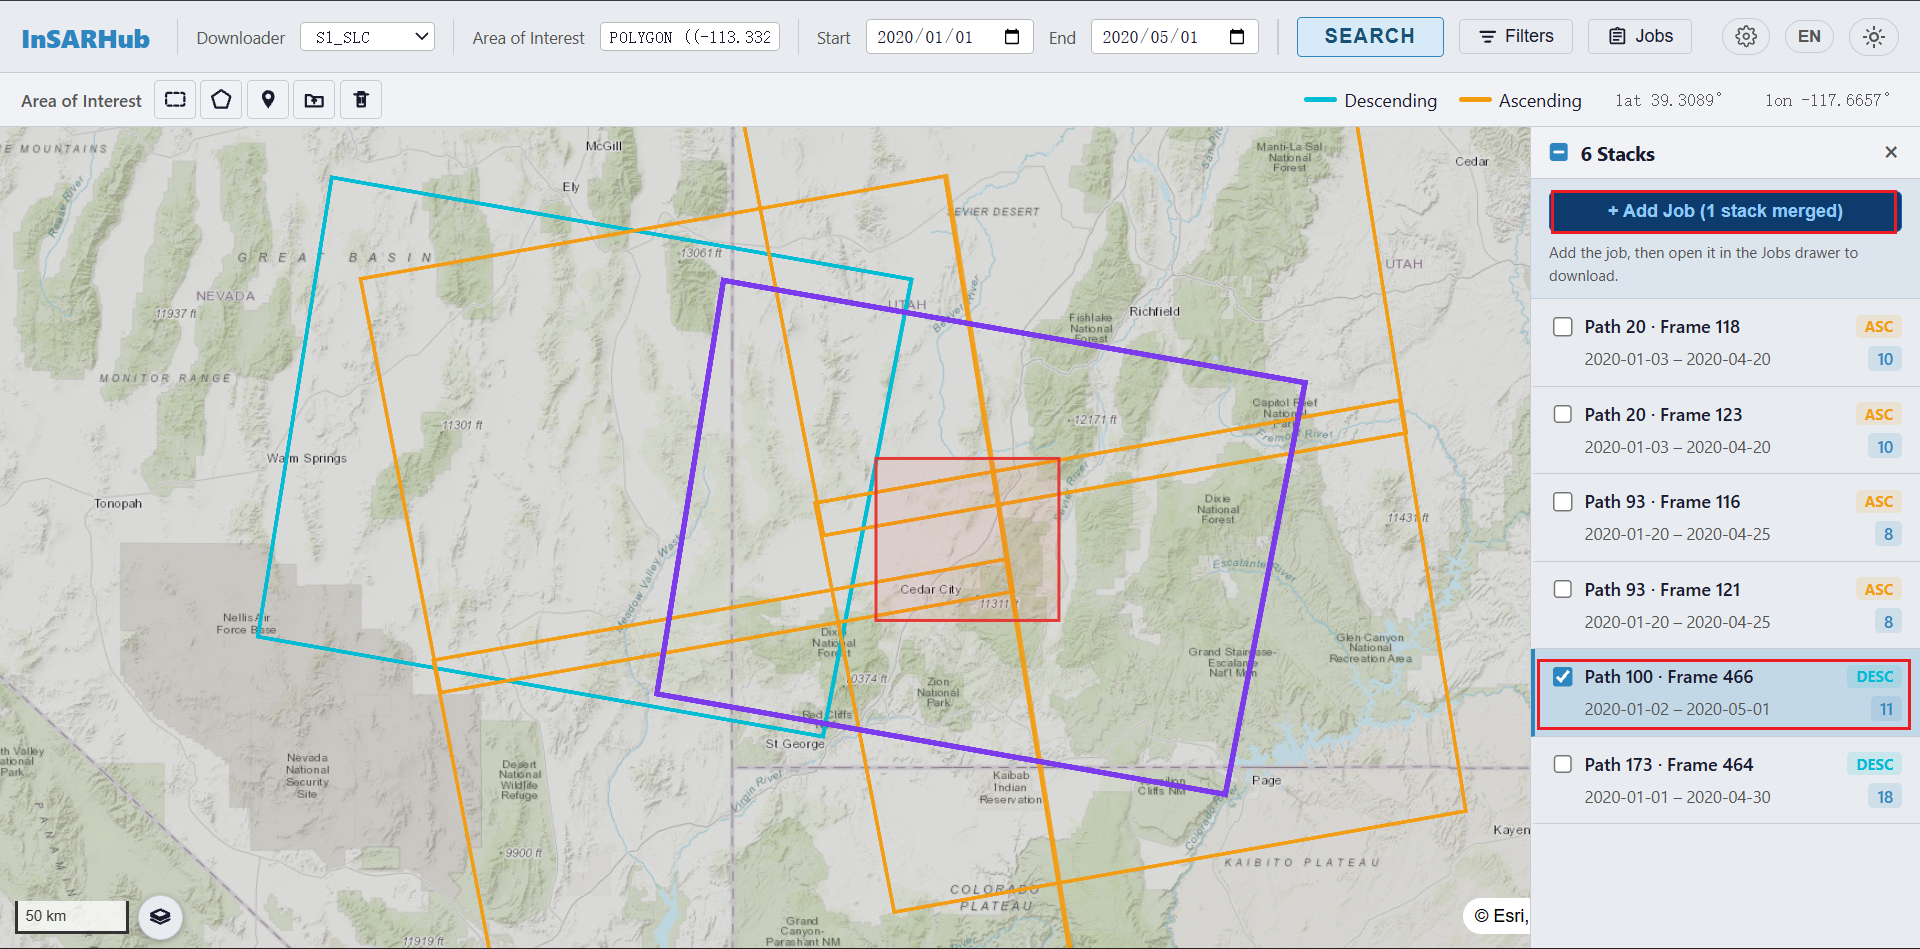
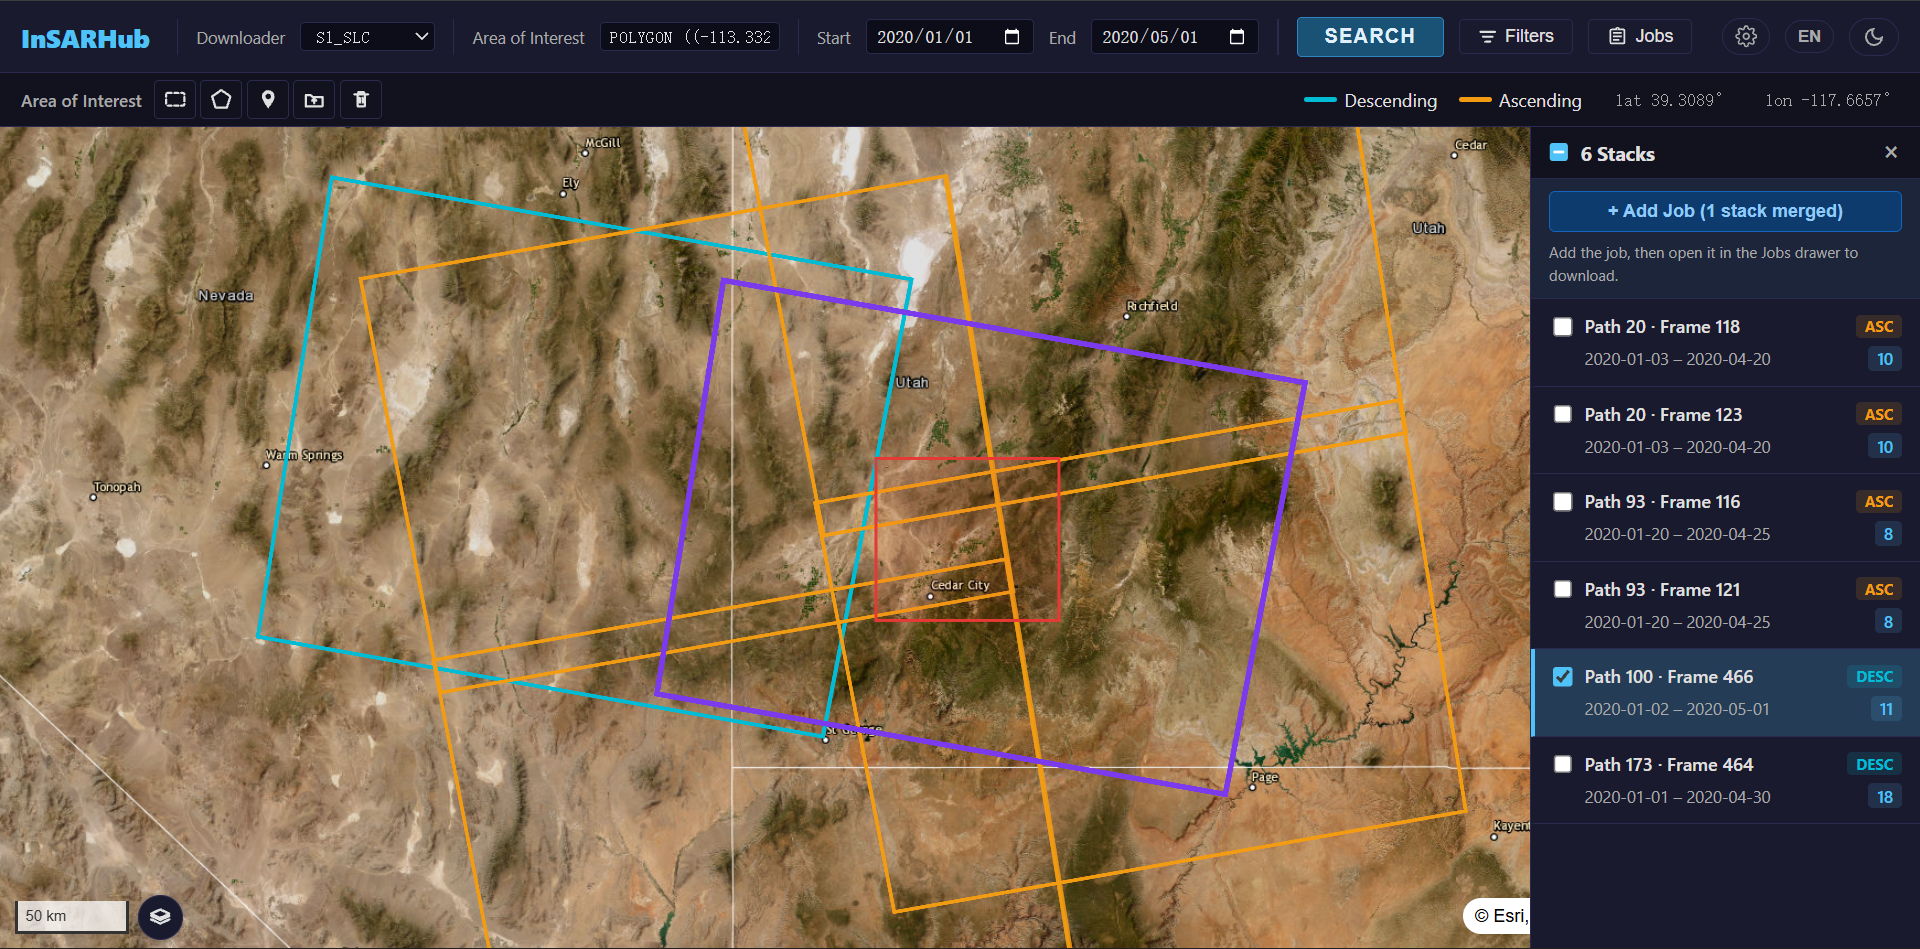
Search result footprints displayed on the map. Click a footprint to view scene details.
Downloading
After adding job into the work directory, click Jobs on the top panel, a job folder should present with the downloader tag. Click the tag will lead you to download options.
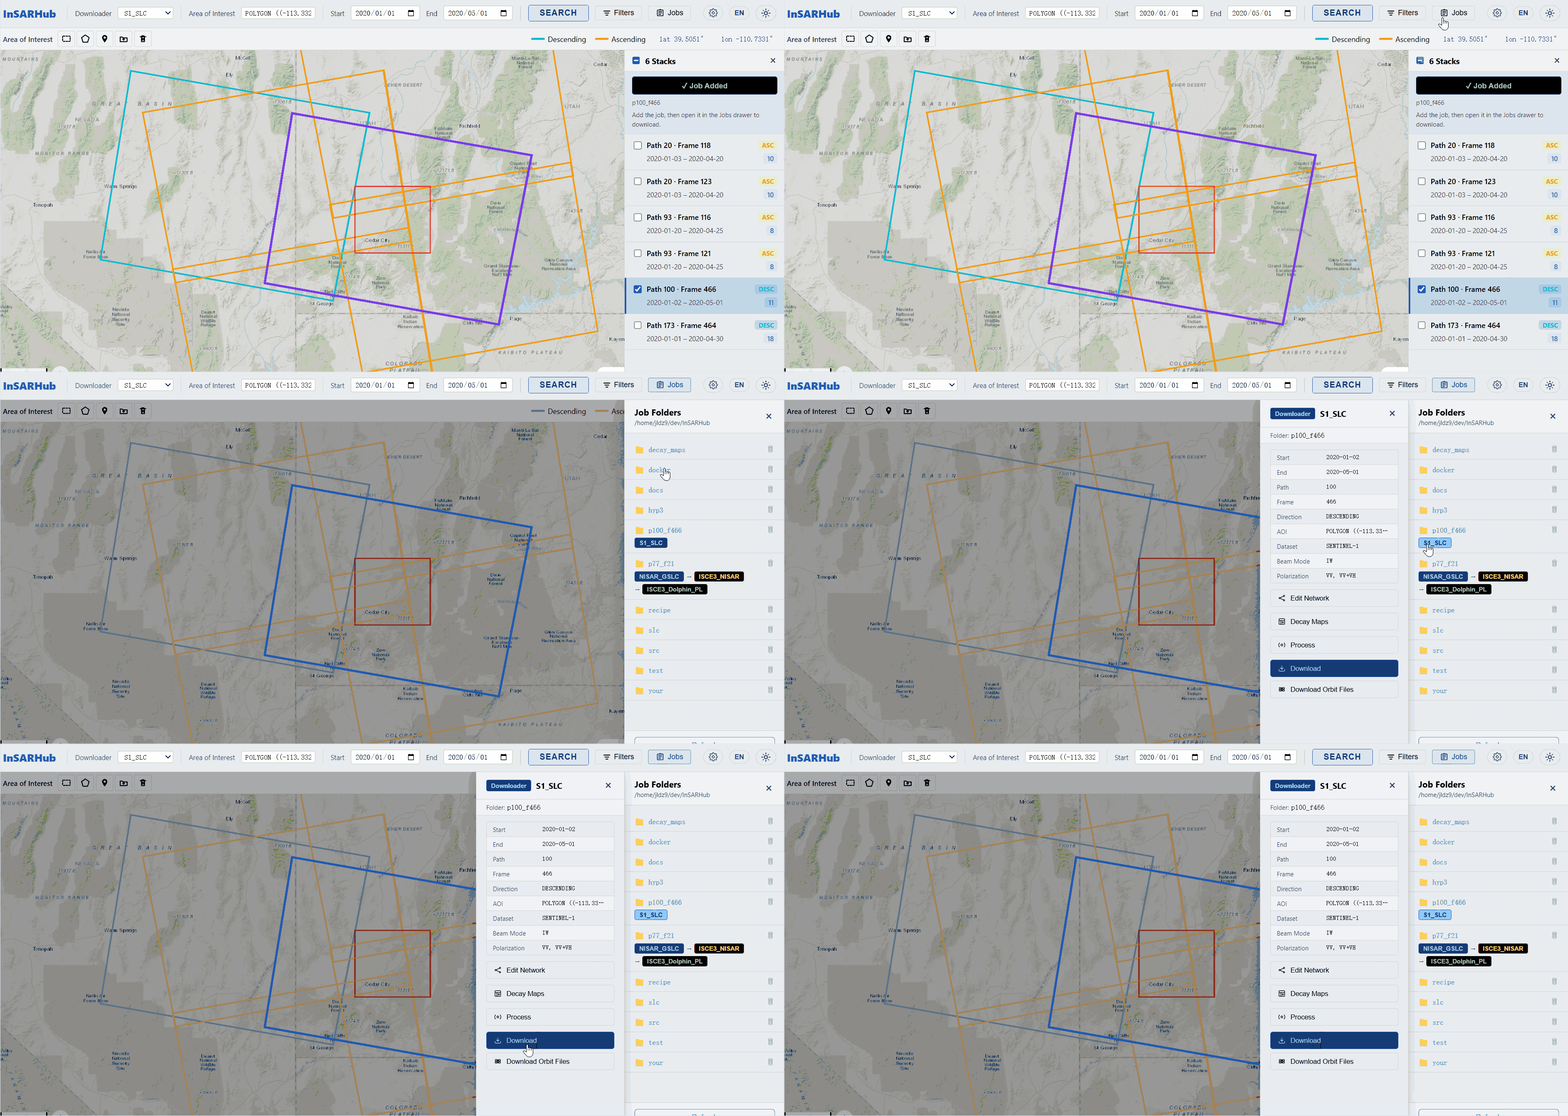
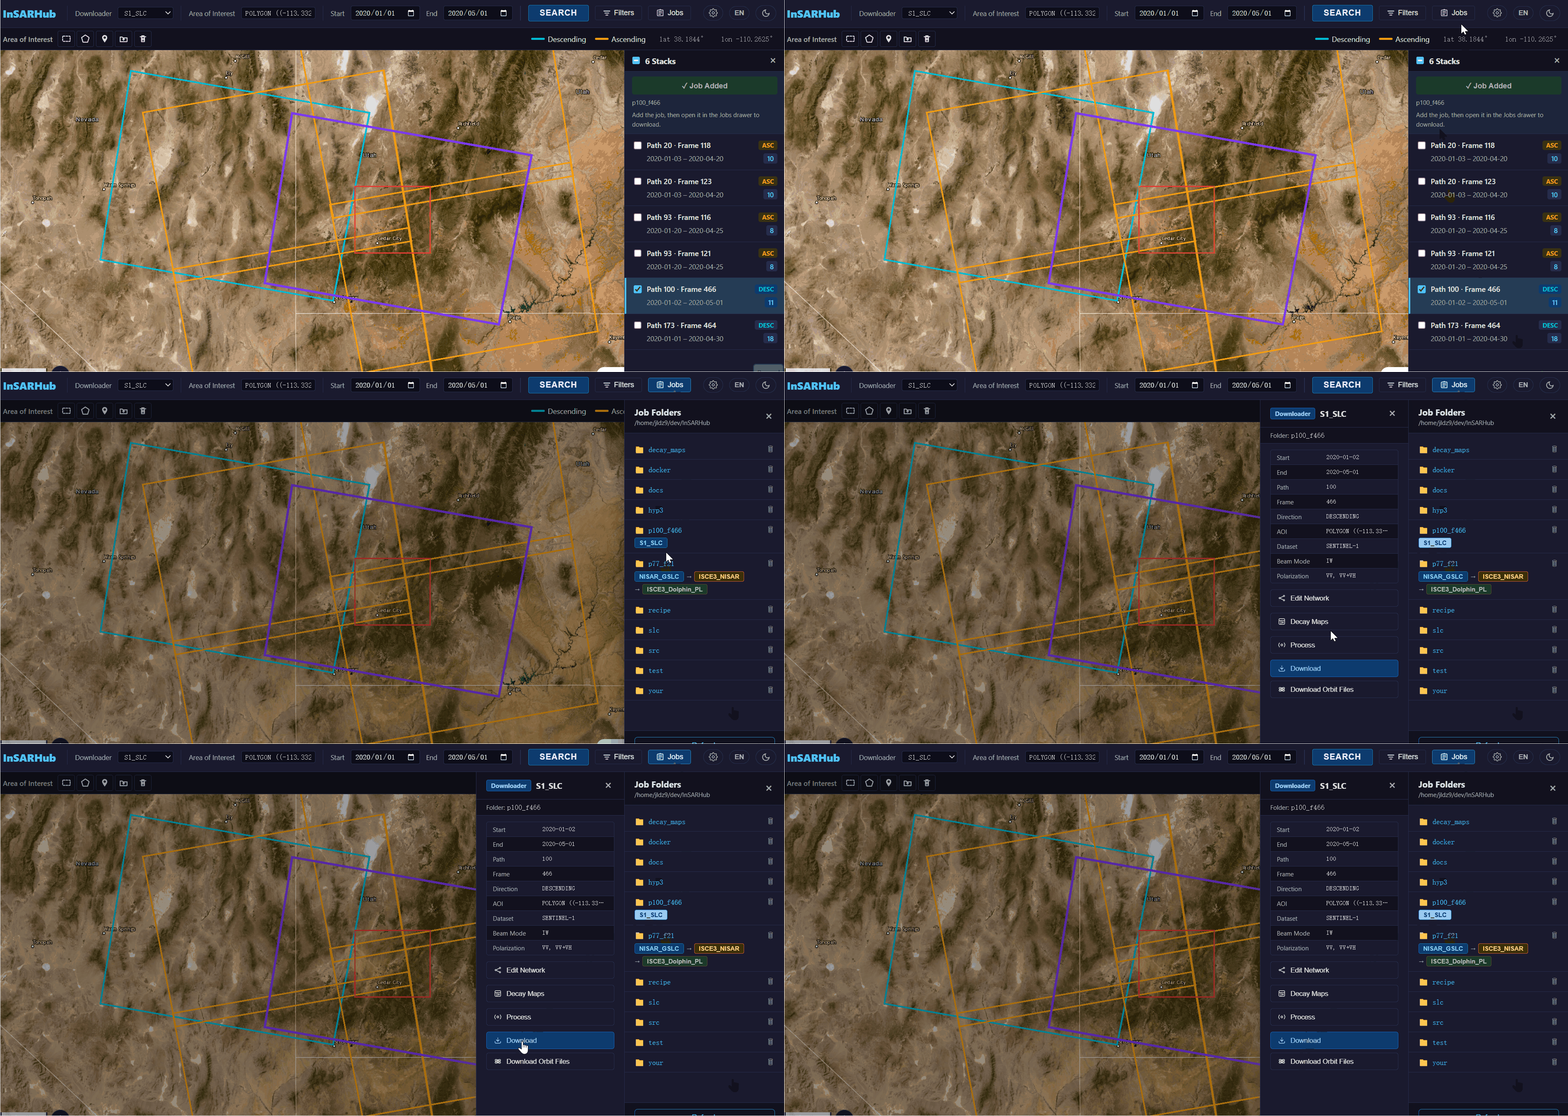
Add a new job to the work directory
For a full description of all downloader parameters and options, see the Downloader Reference.
Downloading Orbit Files
Click Download Orbit Files to download the corresponding precise orbit files for the stack. Orbit files are required for accurate InSAR processing and will be saved alongside the scene data in the work directory.
Selecting Pairs
Constructing a well-designed interferometric pair network is a critical step in time-series InSAR analysis.
In your job panel, click Edit Network to open the interactive baseline–time graph editor.
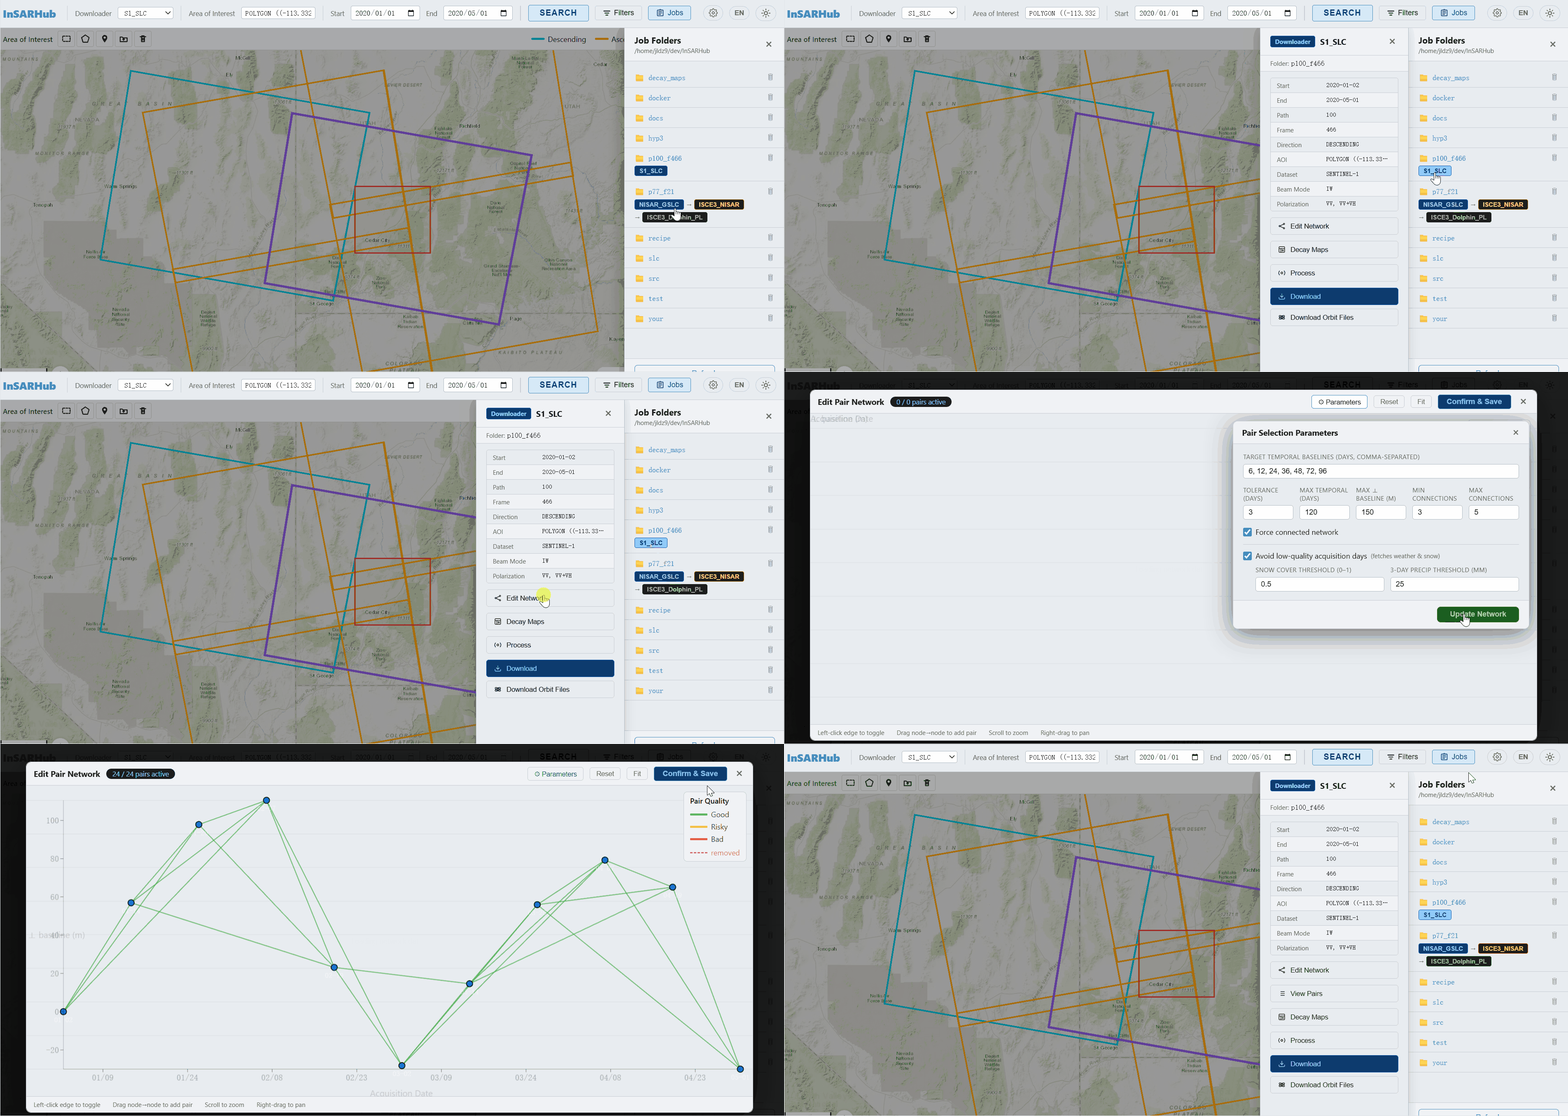
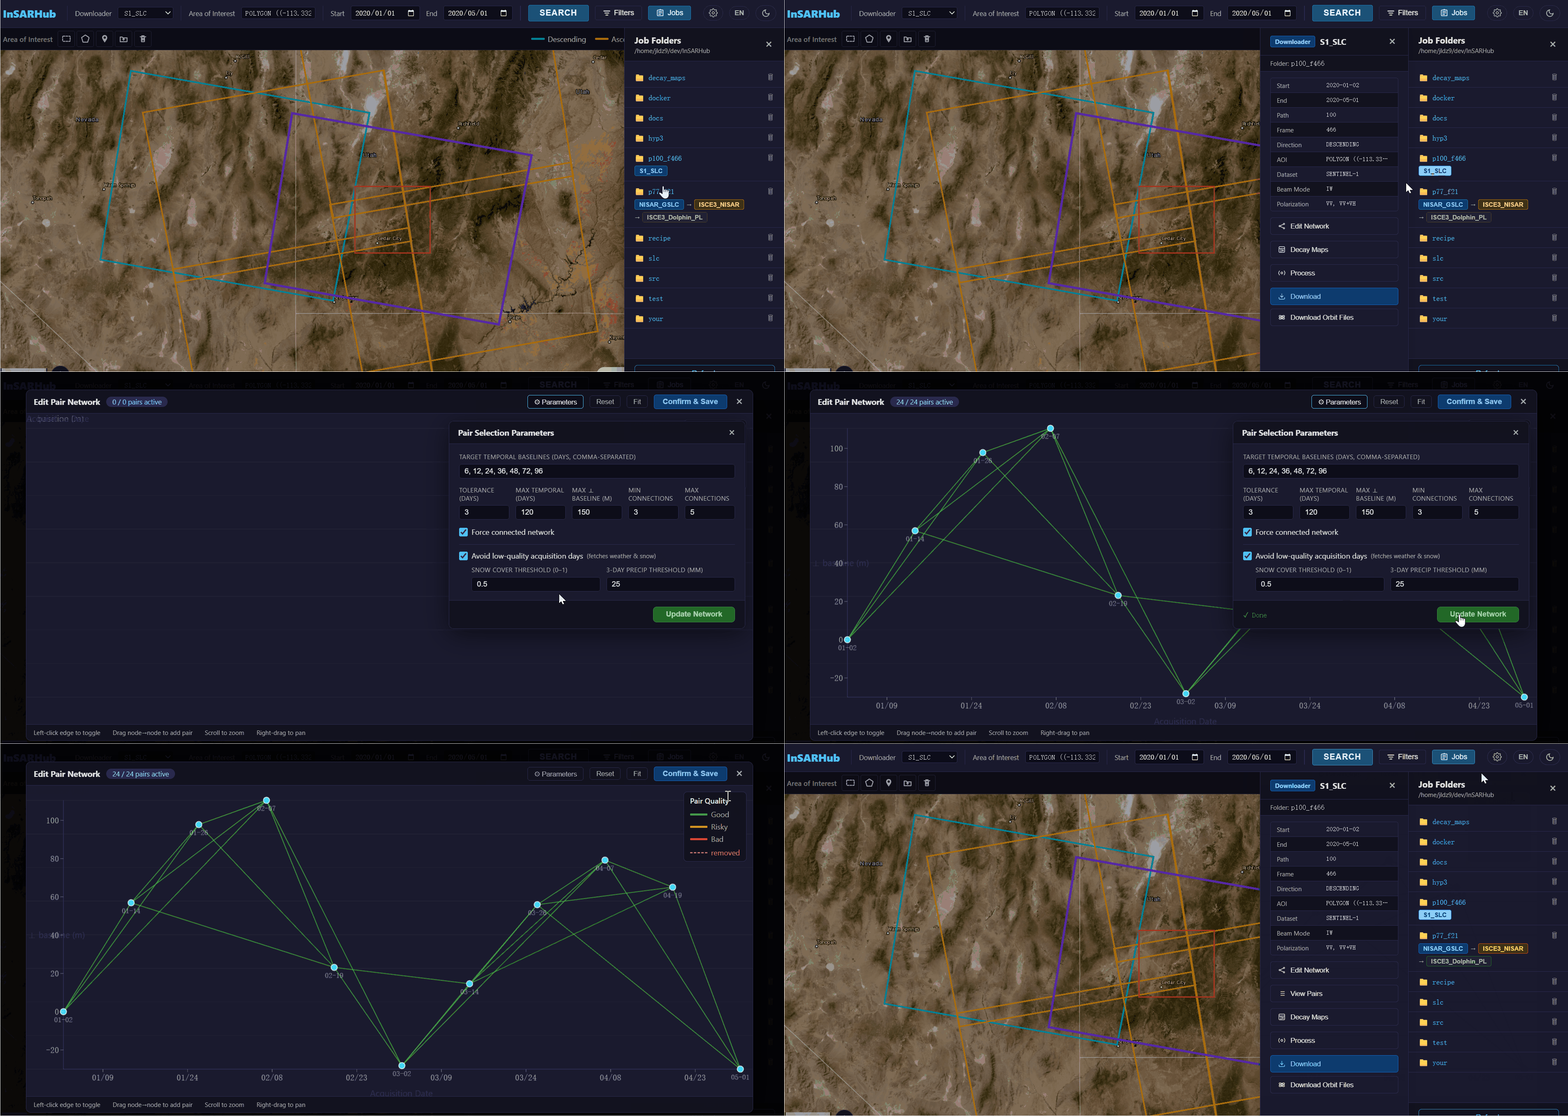
Select Edit Network to open network modification window
The network graph is interactive. Drag from one scene node to another to create a new pair. Click an existing edge to remove it from the network. Hover over any edge to view its temporal baseline, perpendicular baseline, and quality score.
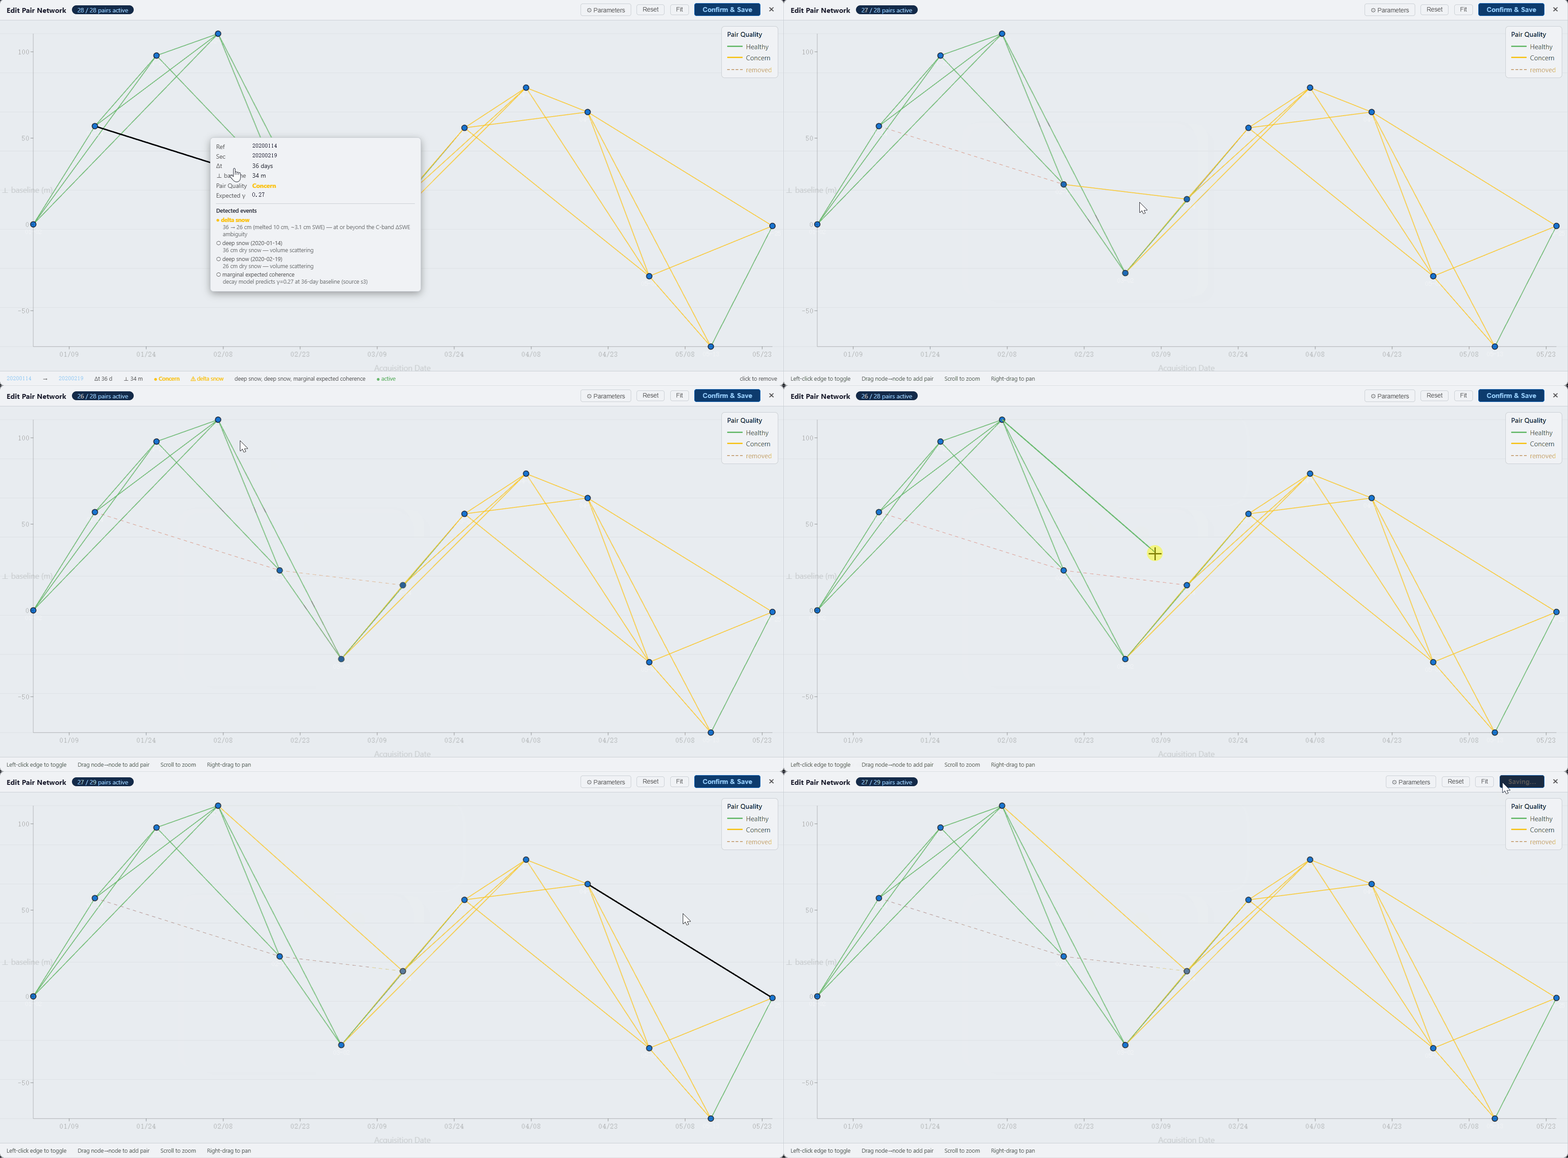
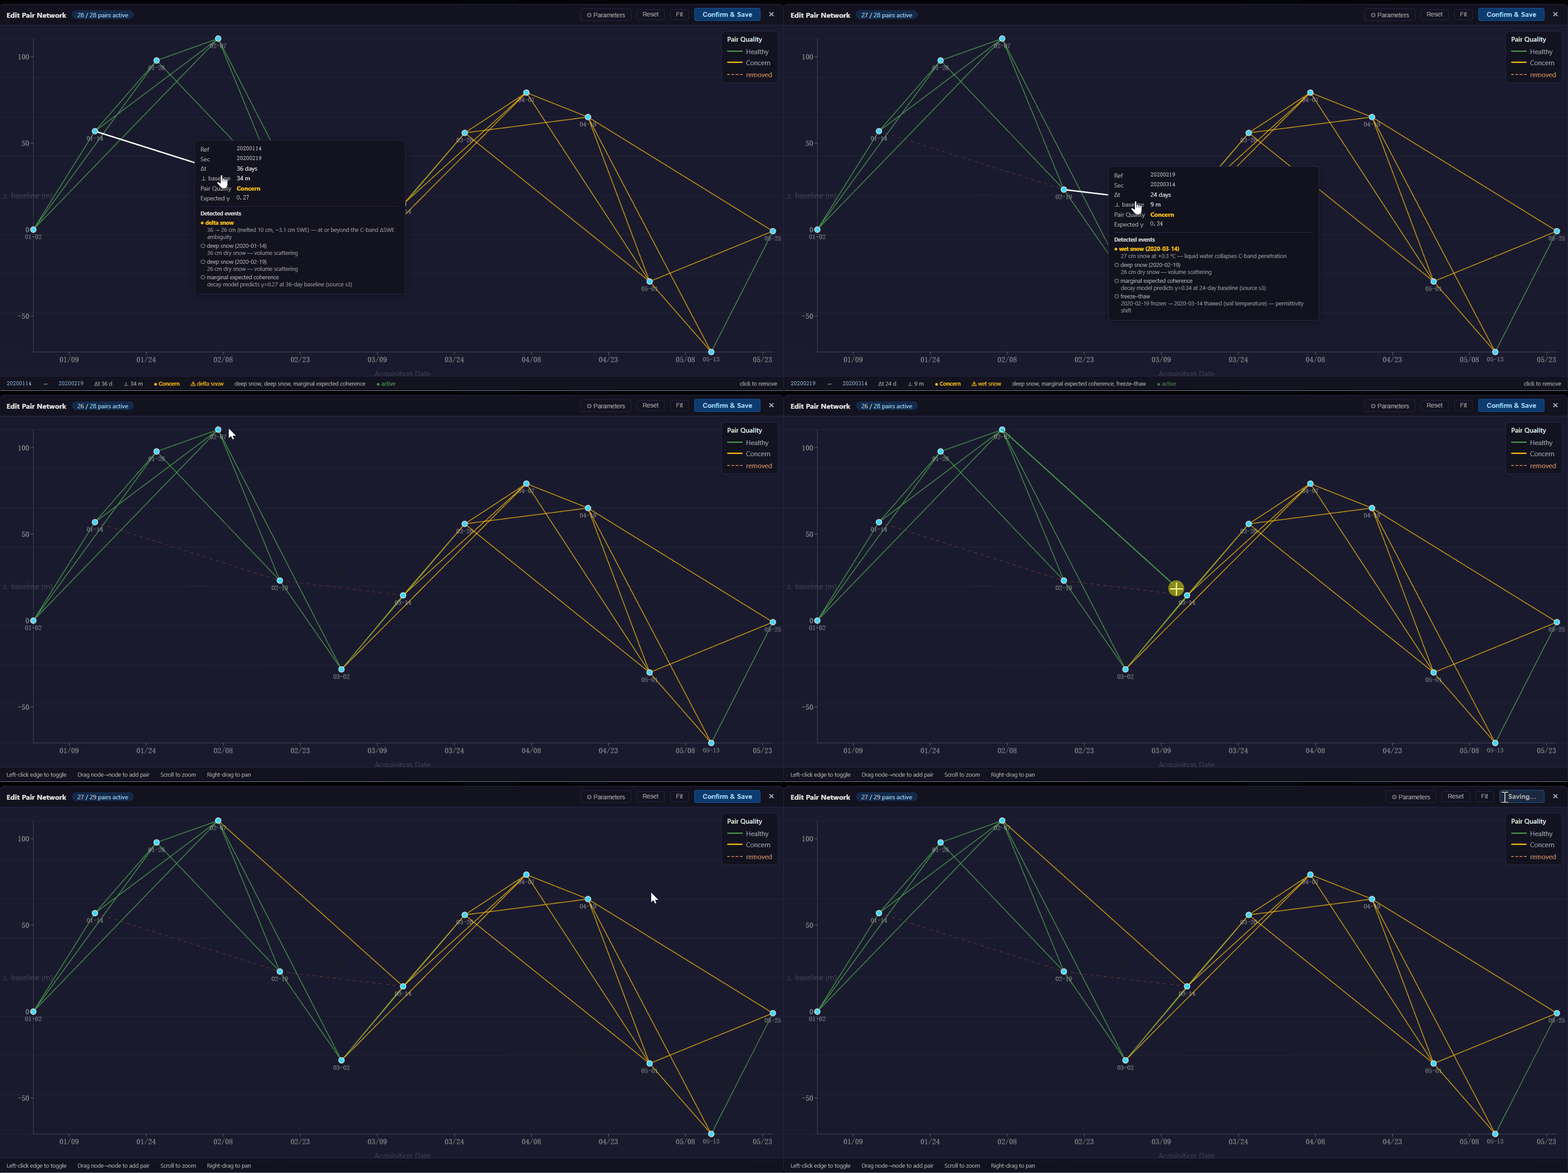
Baseline–time graph showing the interferometric network. Click any edge to toggle it, or drag between nodes to add a new pair.
Edge colors reflect the pre-computed pair quality score — green edges are high quality, yellow are moderate, and red are poor. Hover over any edge to view its temporal baseline, perpendicular baseline, and quality score.
The network editor supports two workflows:
Manual editing — click any edge (interferogram pair) to toggle it active or removed. Drag from one scene node to another to create a new pair. Click Save to persist the updated pair list to the job folder.
Auto pair selection — click ⚙ Parameters to generate the network automatically from the scene stack:
| Parameter | Description |
|---|---|
| Target Temporal Baselines | Comma-separated target temporal separations (days) to form pairs around |
| Tolerance | Allowed deviation (days) from each target baseline |
| Max Temporal | Hard upper limit on temporal baseline (days) |
| Max Perp. Baseline | Hard upper limit on perpendicular baseline (m) |
| Min Connections | Minimum number of interferograms each scene must participate in |
| Max Connections | Maximum number of interferograms per scene |
| Force Connected Network | Add extra pairs to guarantee no isolated nodes |
View Pairs — lists all selected interferometric pairs with their temporal and perpendicular baseline values.
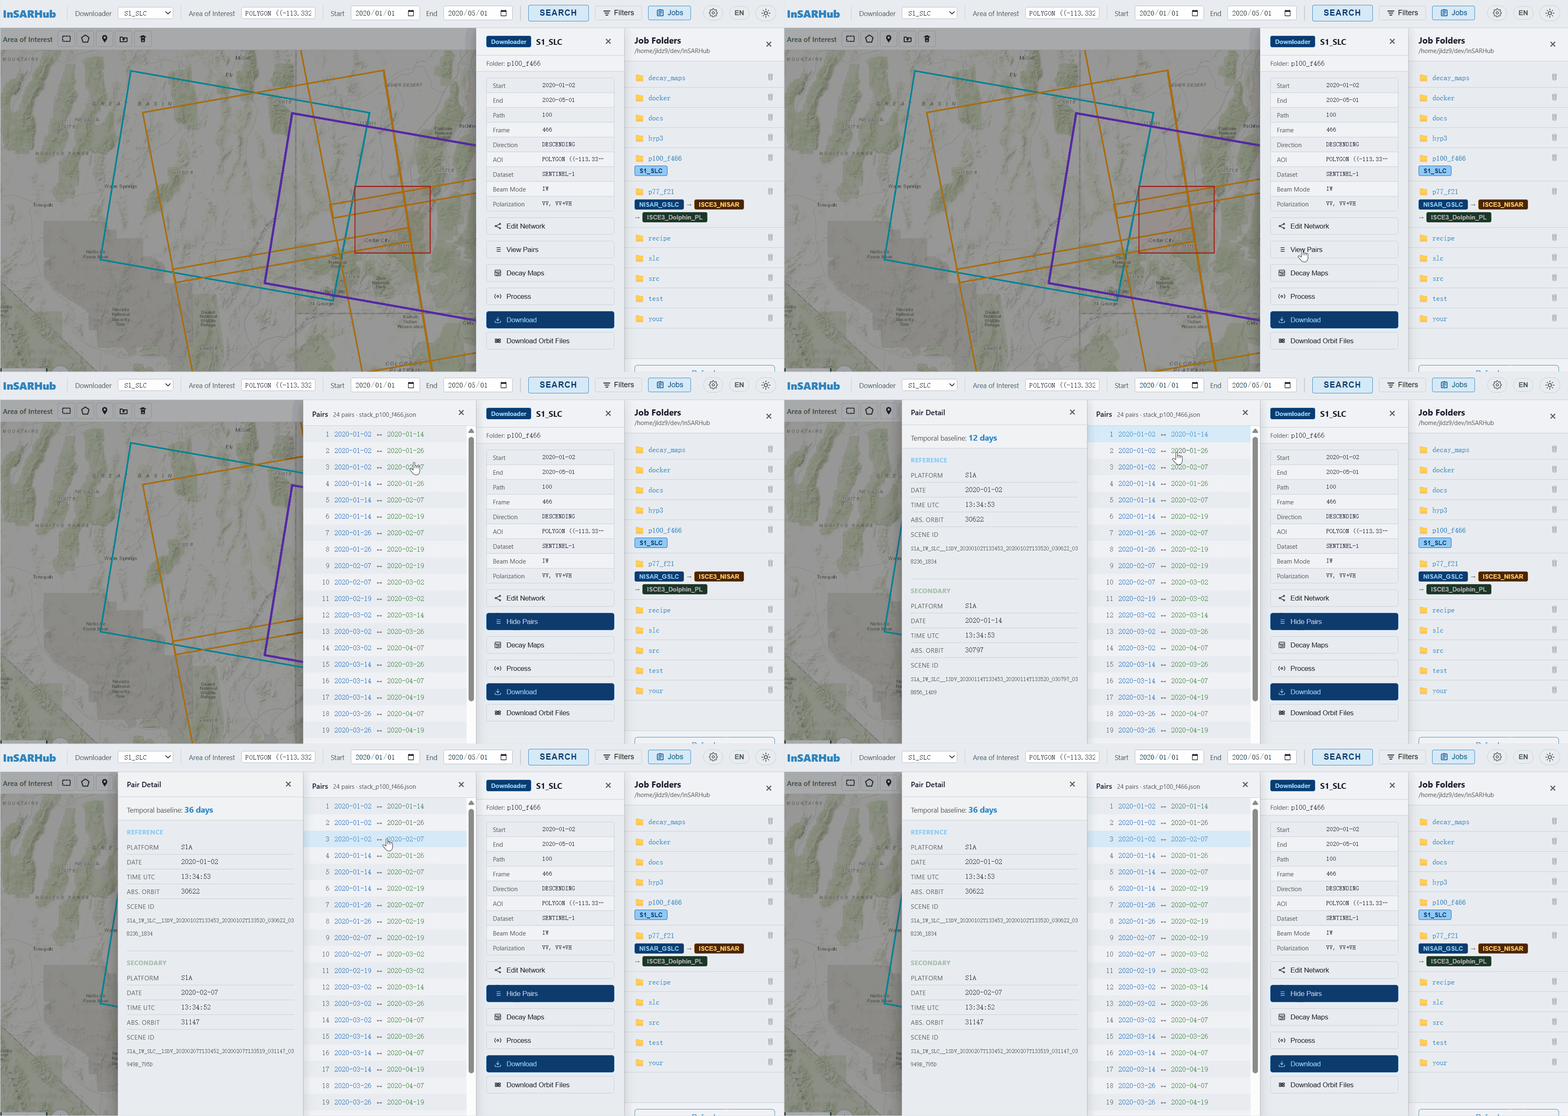
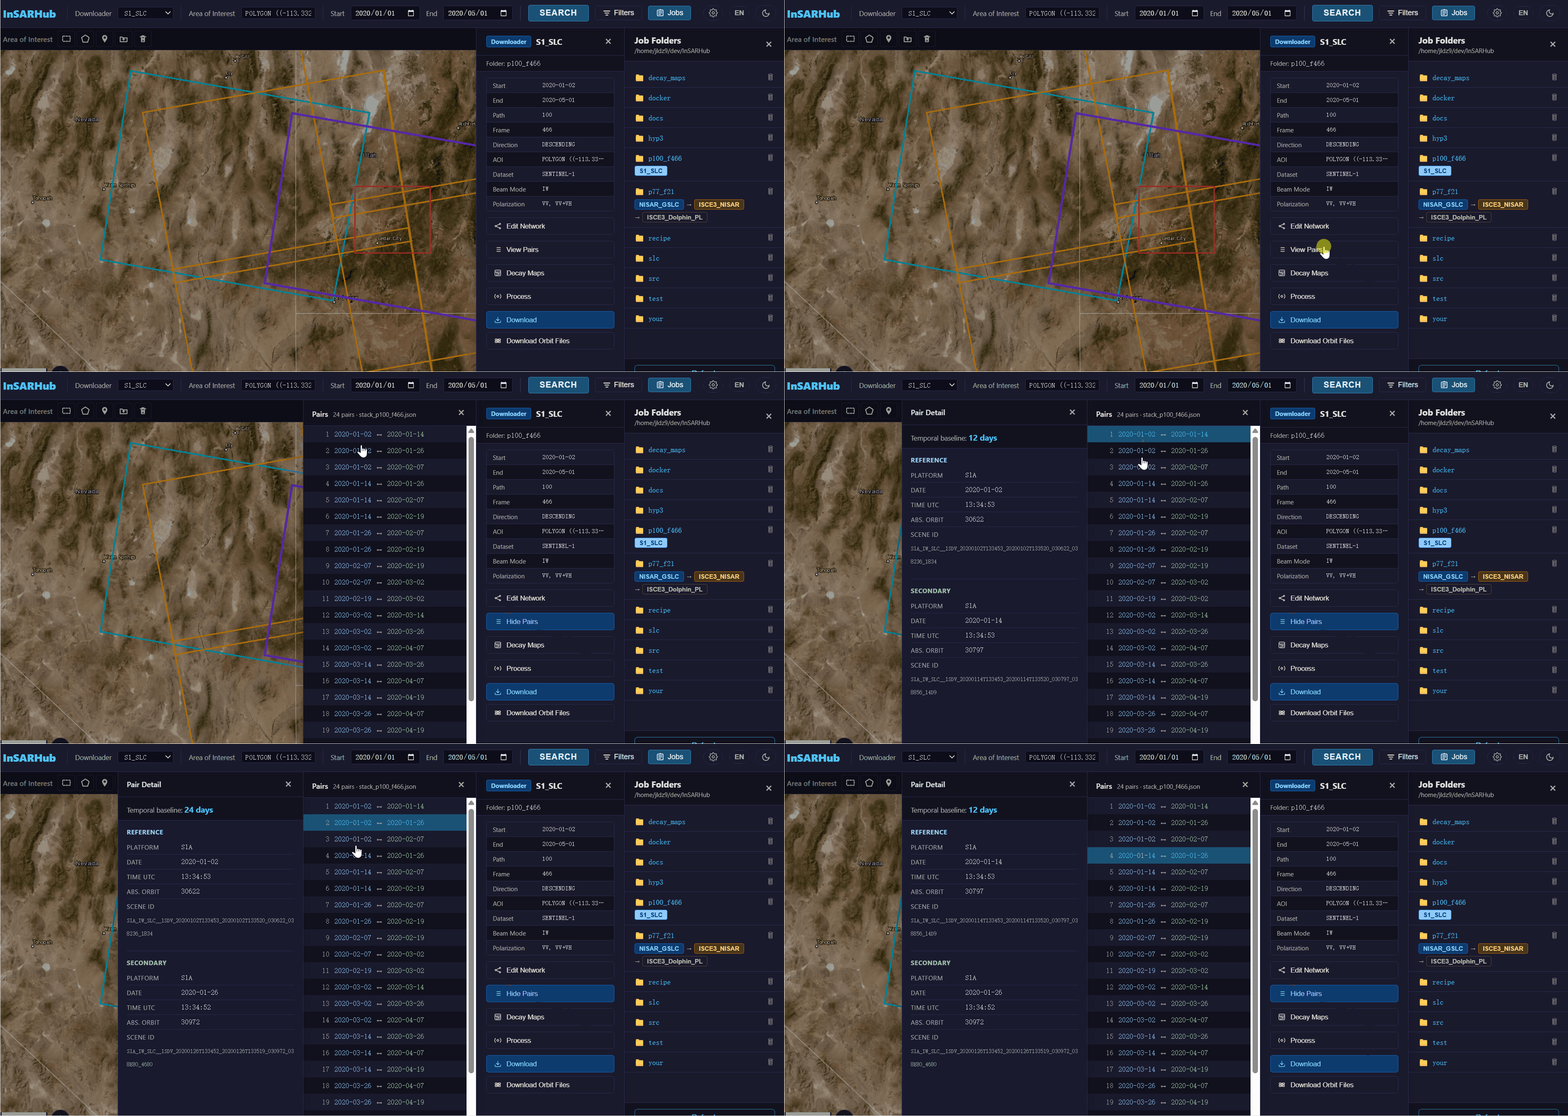
List of selected interferometric pairs with baseline information.
Decay Maps
Click Decay Maps to open the Coherence Decay Maps drawer. This overlays seasonal S1 Global Coherence maps on the main map, giving you a quick read on expected coherence at your site before submitting any jobs.
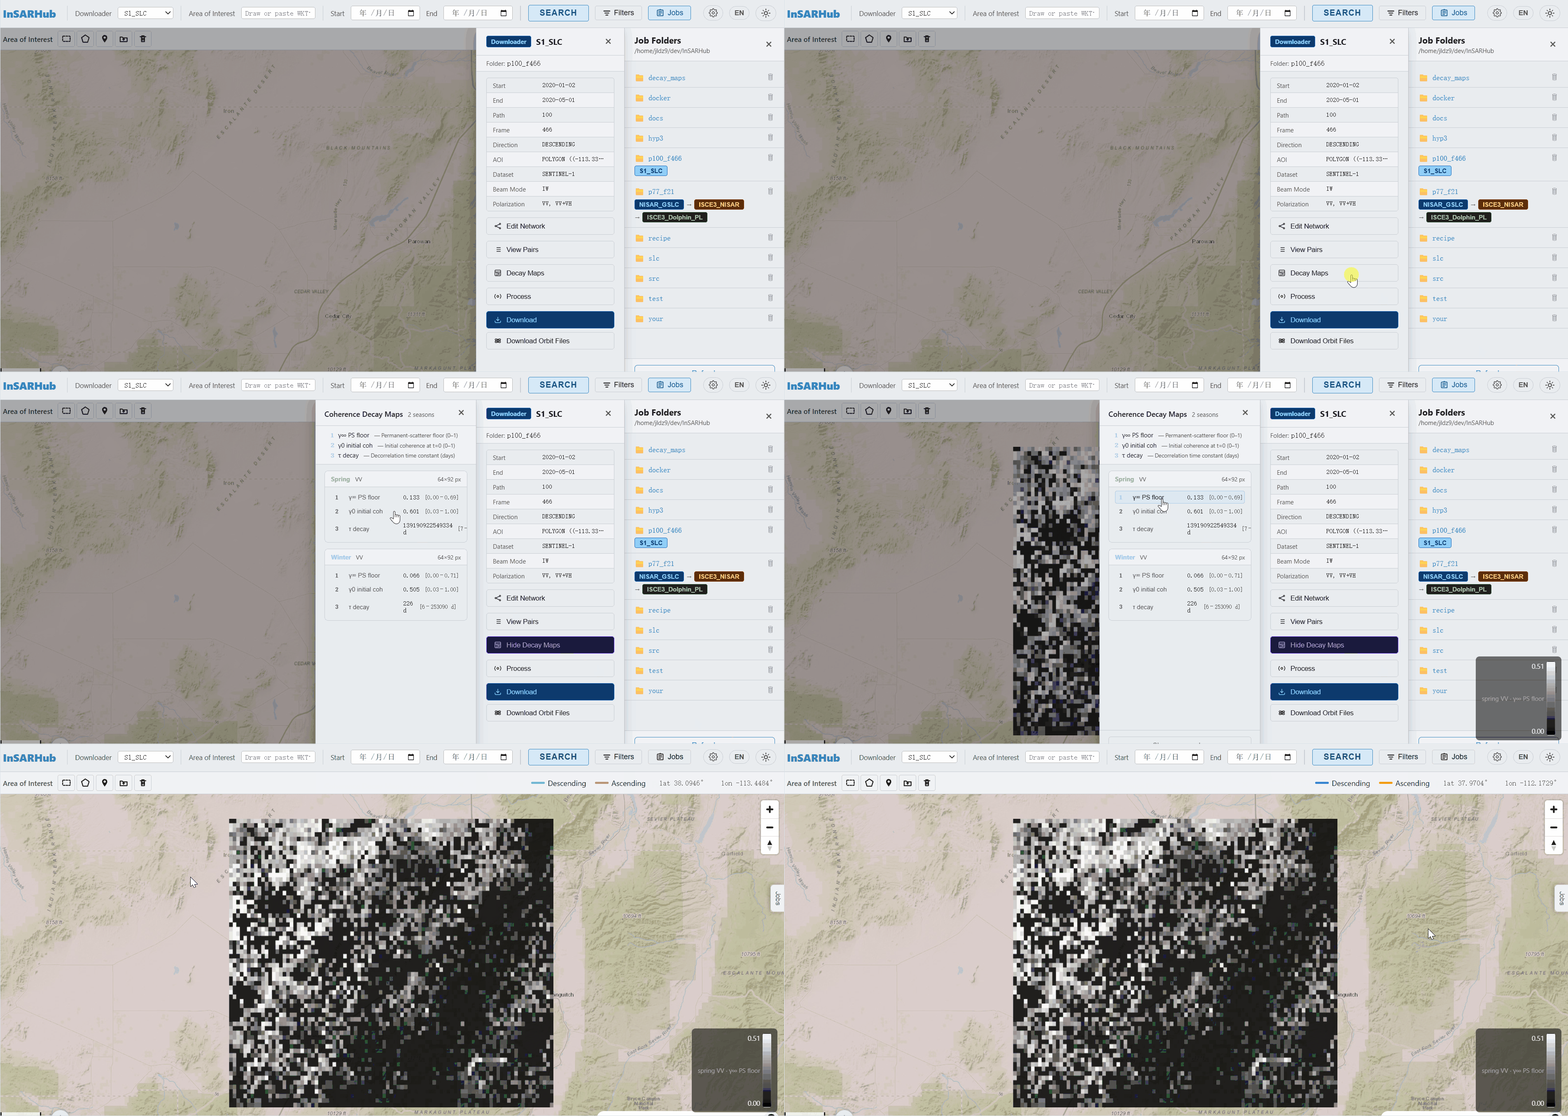
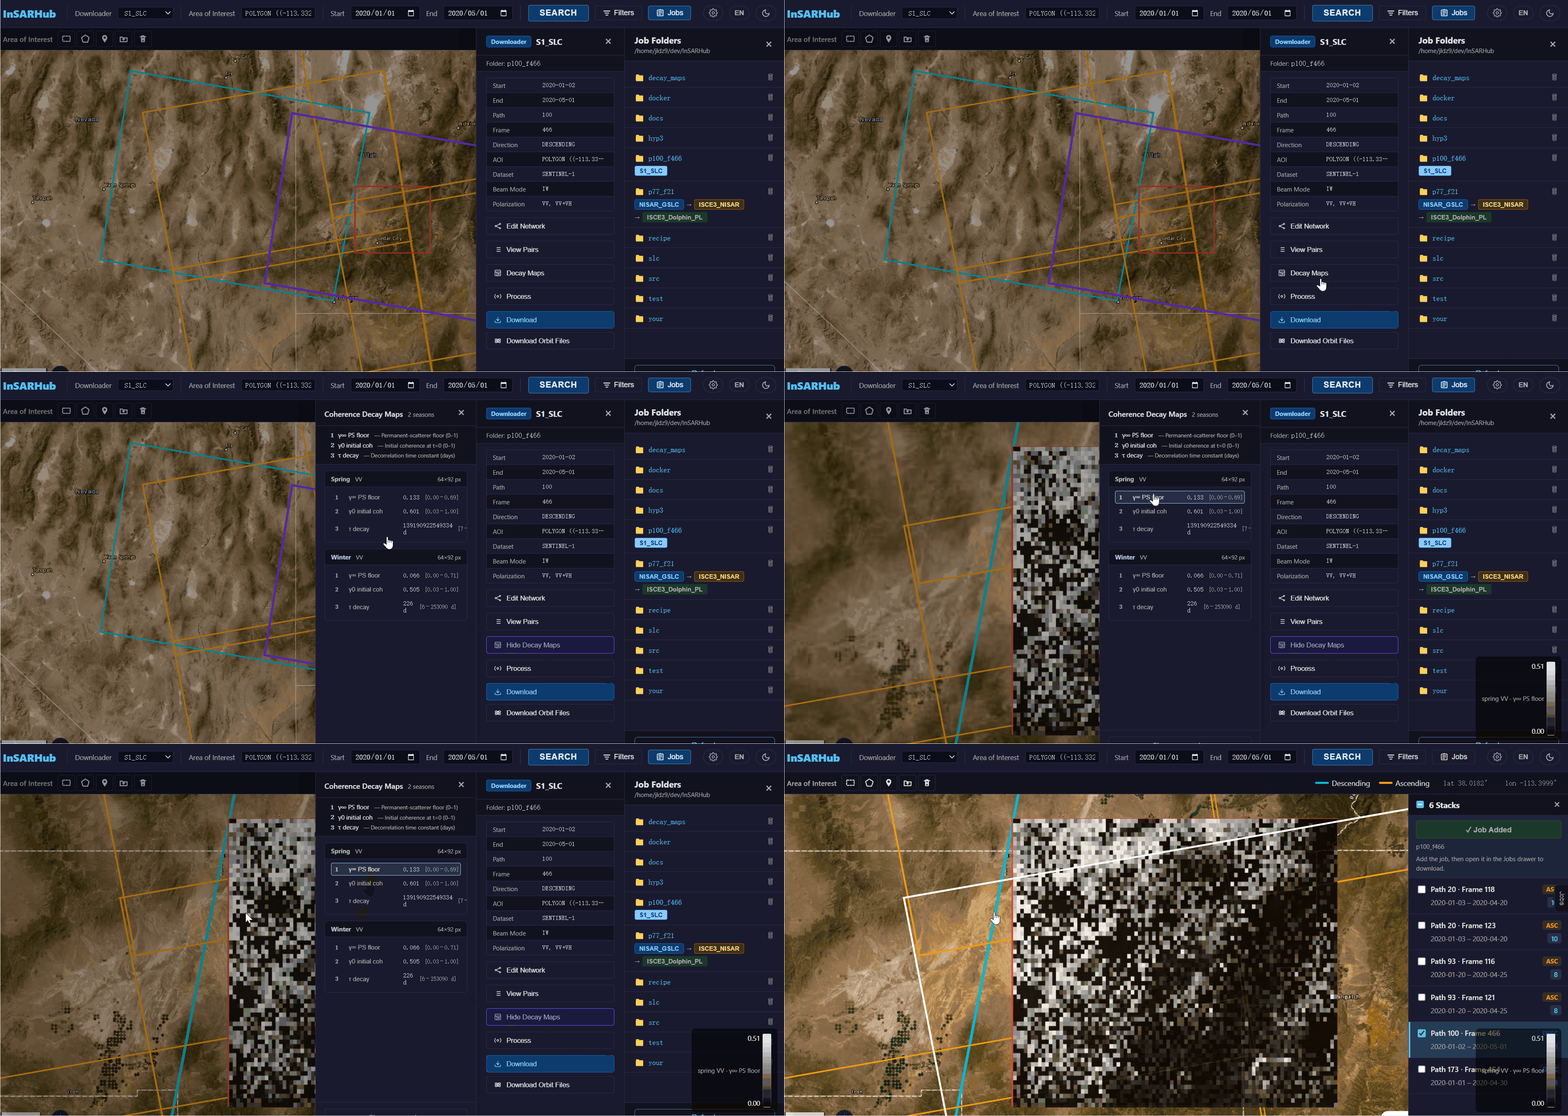
The Decay Maps button in the downloader job panel.
Each available season and polarization is listed. Click any of the three band buttons to overlay it on the map:
| Band | Symbol | What it shows |
|---|---|---|
| 1 | γ∞ PS floor | Permanent-scatterer coherence floor — the minimum coherence that persists regardless of time gap |
| 2 | γ0 initial coh | Initial coherence at acquisition — higher values indicate better short-baseline coherence |
| 3 | τ decay | Decorrelation time constant (days) — larger values mean coherence persists longer |
Once your job is added, head to the Processor panel to select interferometric pairs and submit them for processing.